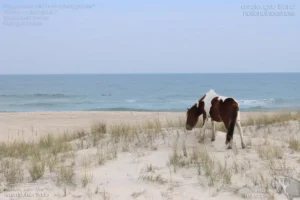
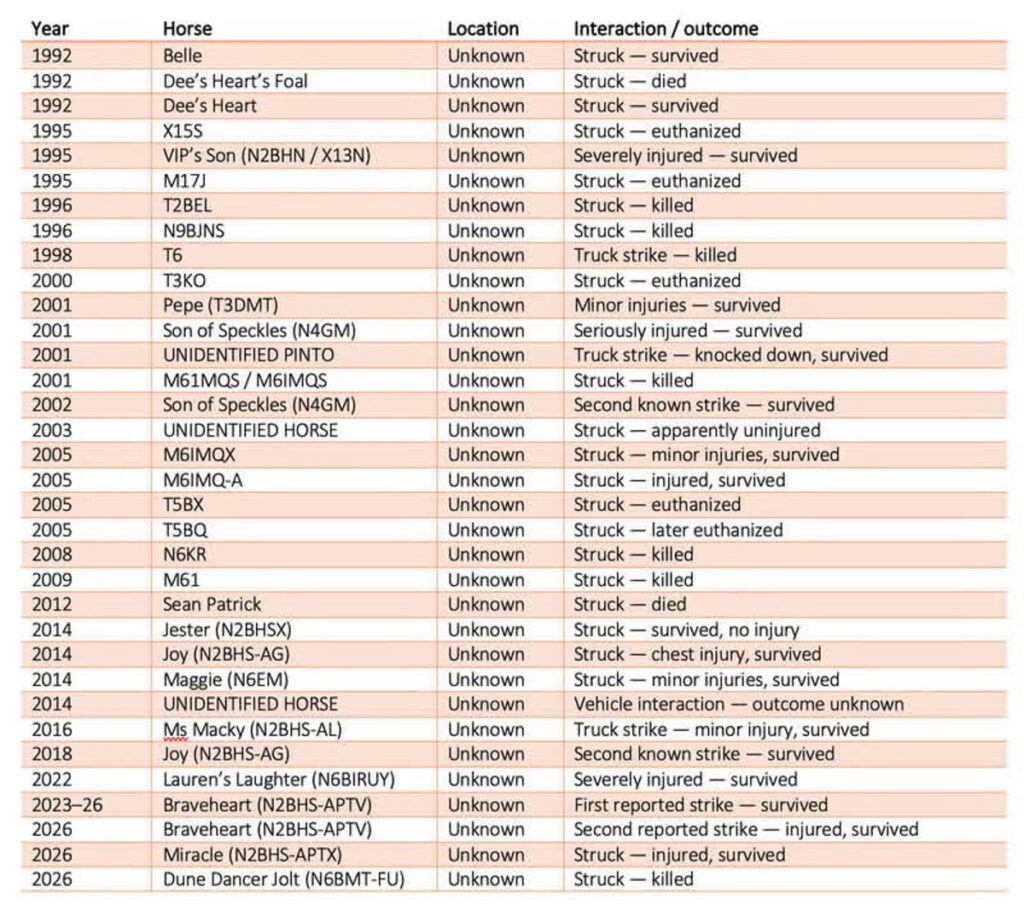
Preliminary data is in… However, we really need locations. If anyone has information regarding the list of horse-vehicle interaction locations (the table below), such as Bayberry Drive or the Causeway/611. Also, whether the road was straight or curved is useful. Any photos of the horses in the list would be incredibly helpful. Email (merry@equusferus.com). Thank you all! Together we can keep the Assateague Island horses safe.
—————————————–
Remember the paragraphs below are based on the current data- we hope to update the database with the public’s help. These only represent horses in which the location of the collision is not known.
Using the currently available data for all Assateague Island horse-vehicle collisions (i.e., the input data), there appear to be strong seasonal components, with summer being the highest-risk season, with the highest numbers of horse-vehicle collisions in July and August. The model fails to detect any significant increase or decrease in horse-vehicle collisions over time. A preliminary fit of a simple Poisson regression model yields an expected number of collisions per year of approximately 1, with about a 2/3 chance of more than 1 collision per year, given constant parameters.
The causeway to the north of the island’s bridge is a critical location for horse-vehicle collisions, as prior to the reduction in speed limit in 2018 followed by the installation of speed bumps in 2020, there were multiple reported collisions at this location; however, there have been no reported causeway collisions since the installation of speed bumps at this location. While the reduction in collisions at the causeway location is encouraging, given the small number of total island collisions and, in particular, recent ones for which the location is unknown, it is not yet possible to determine with statistical certainty whether the reductions in collisions at the causeway location are a result of the recent interventions.
Furthermore, our current data does not allow us to assess whether there are differences in the types of horses that are more frequently involved in collisions (i.e., colours, ages, sexes) and that, for example, the number of horses of each type that are exposed to vehicles on the island’s roads would need to be ascertained. However, with input of dates, locations, times, and roads for recently occurring collisions, as well as increased traffic counts, a more powerful model for assessing the risk of horse-vehicle collisions on the island would eventually be possible, thereby enabling the assessment of, e.g., the locations and times of the highest risk of such collisions.
©dr meredith hudes-lowder 2026